
2.3 million people and growing.
19X return for every dollar.
The results from two different program cohorts in Uganda, one at the 60-month mark (achieving 19x ROI) and one at the 24-month mark (achieving 6x ROI), demonstrate sustained income growth, strong returns on investment, and lasting progress beyond graduation.
Lasting impact at a fraction of the cost.
The results of an indpendent randomized controlled trial (RCT) show that our universal graduation program achieves comparable impacts on income, assets, food security, and well-being to traditional graduation and cash-based programs—but at dramatically lower cost, and with benefits exceeding costs within three years.
How change happens
Our impact is shaped by the levers that most reliably improve household income and production and build resilience. Data guides focus, adaptation, and scale.
Data for action
Data guides where we focus, how we adapt, and how we innovate. It directs design, strengthens delivery, and turns learning into greater impact and cost-efficiency.
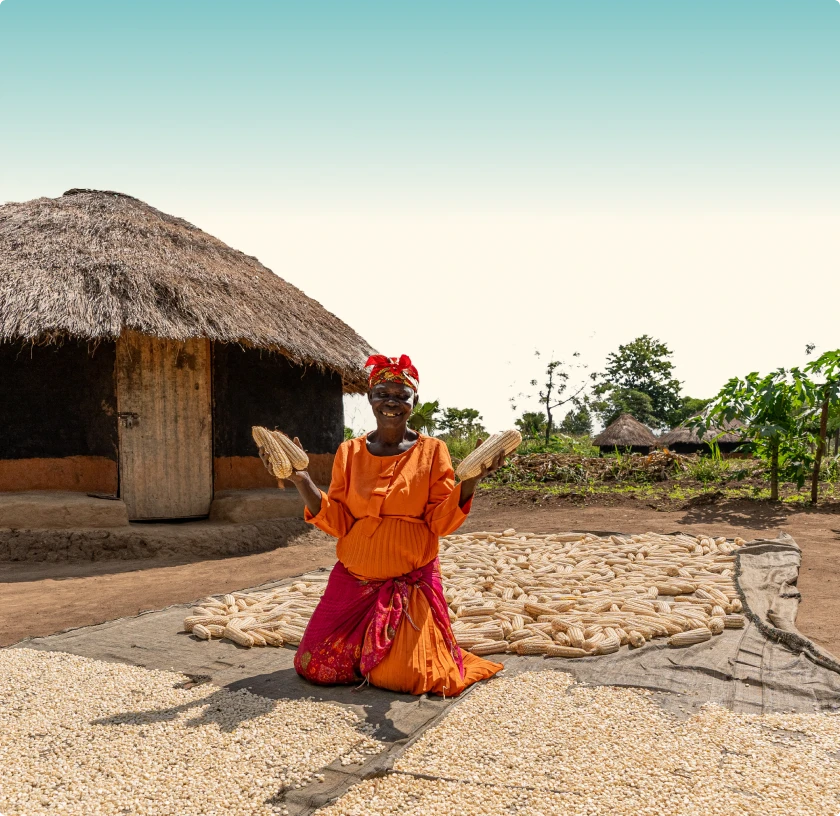
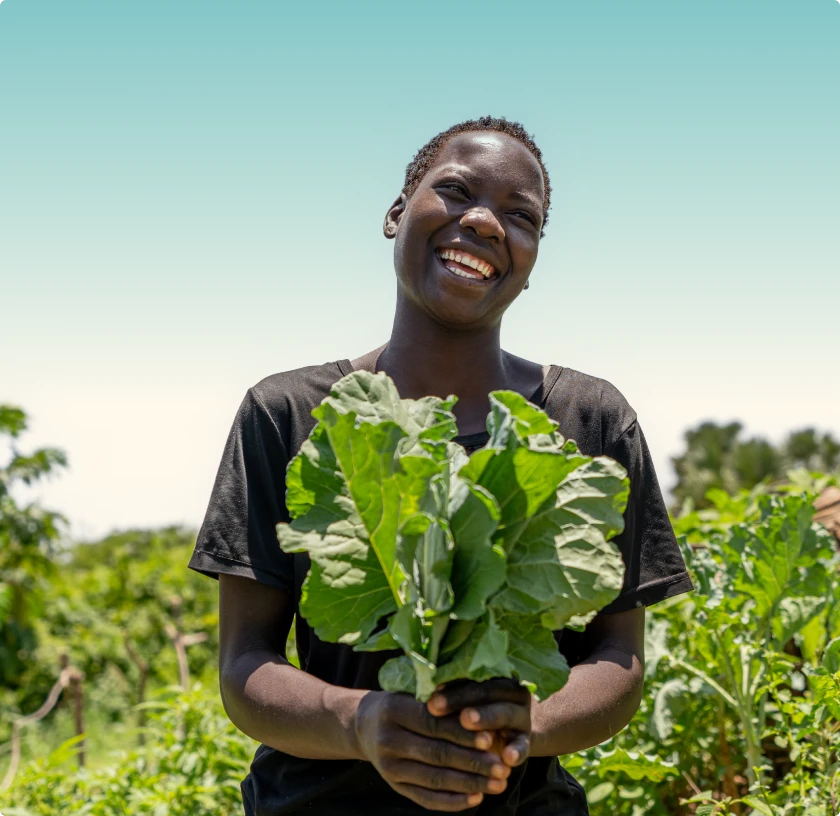
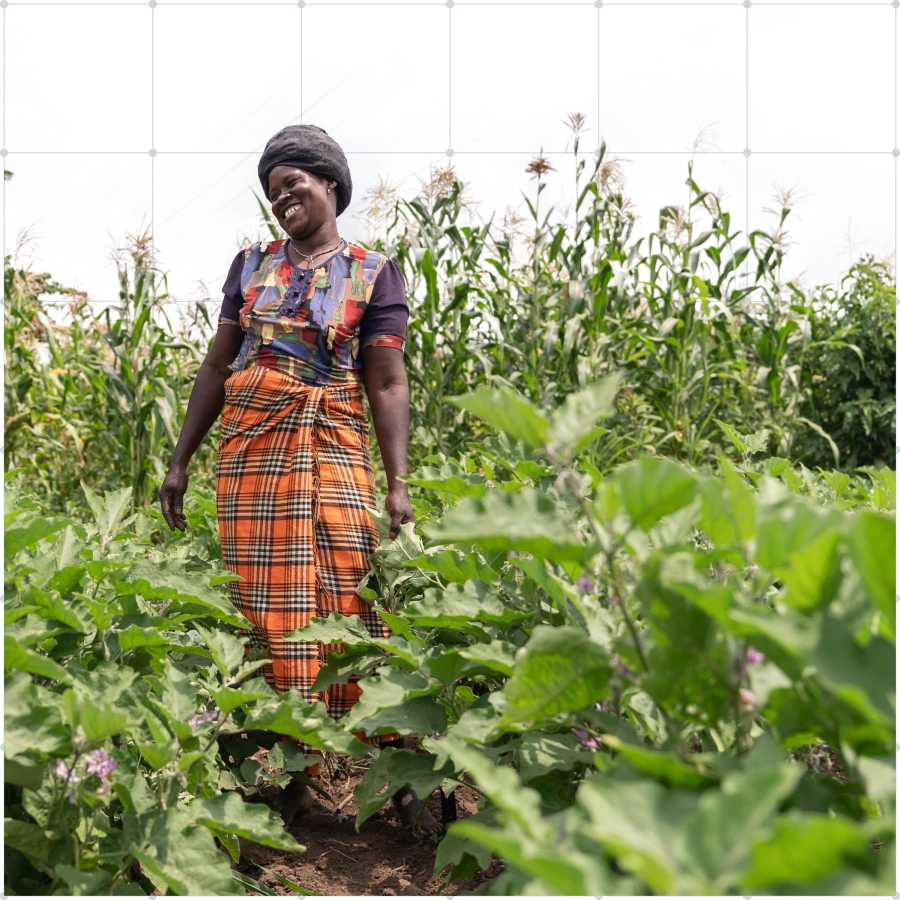
Agriculture optimized for last-mile realities
Our program is optimized for subsistence farming communities and responsive to local contexts, driving the largest gains in income and food security.
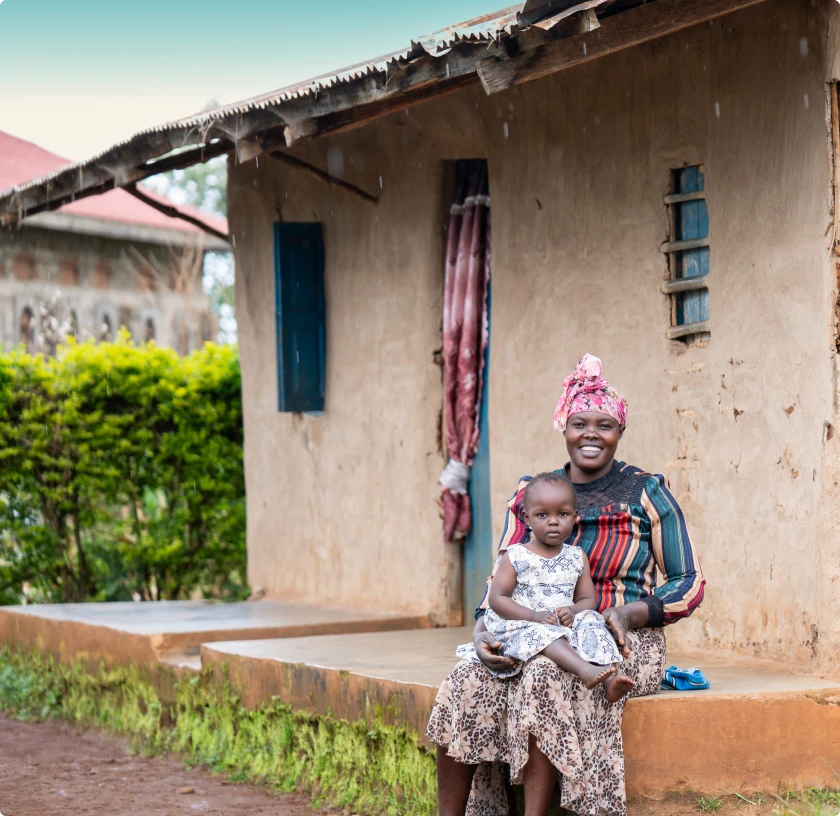
Financial pathways for growth
Households access savings and capital through integrated Village Savings and Loans Associations (VSLAs). This enables all households, including those led by women and youth, to invest in their future, manage risk, and sustain income growth.
Driving adoption at scale
Group training and data-informed household coaching drives behavior change and focuses effort where it matters most.
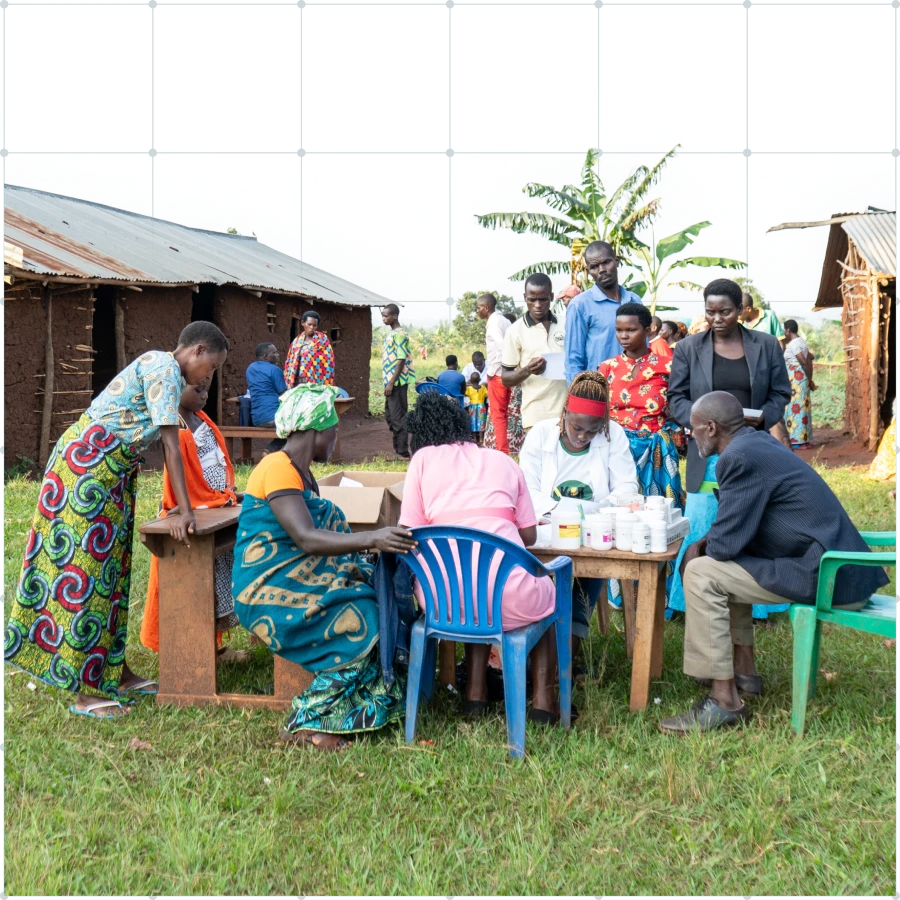
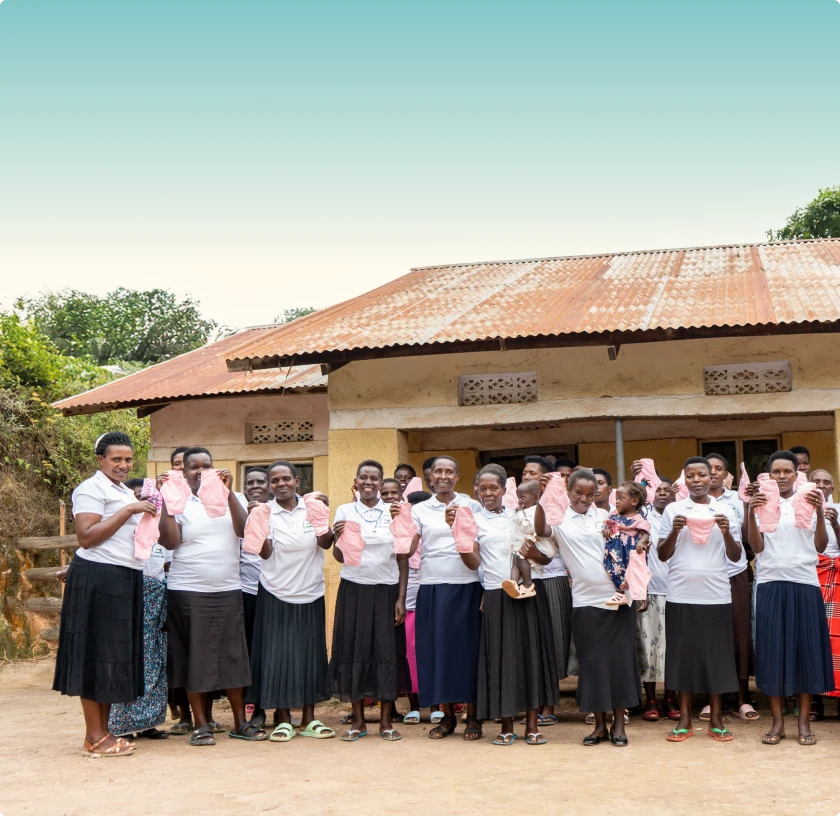
Wraparound supports that remove barriers and improve wellbeing
Targeted health, WASH, and food security initiatives reduce barriers that undermine income and participation.
Universal and collective participation
All households in a community participate, which builds social and peer accountability, accelerates adoption, and optimizes cost-efficiency at scale.
Our impact measurement framework
Our impact results are built on a rigorous measurement framework. Through longitudinal surveys, randomized sampling, and independent data collection, we track household-level change over multiple years to assess outcomes, compare against peers, and validate long-term impact at scale.
Frequently asked questions
Find answers about how our program works and what it delivers.
We understand ultra-poverty as a condition of acute, multidimensional deprivation in last-mile farming communities where households typically earn less than USD$1 per day and face a high risk of remaining poor without sustained, integrated support.
We assess graduation out of ultra-poverty at the cluster level using Household Income and Production (HHI+P) as the primary metric, while examining how income gains relate to improved food security, wealth, quality of life, resilience, and the reduced likelihood of falling back into ultra-poverty.
We use USD$2 per household per day in combined HHI+P as a key program target, grounded in longitudinal data showing that gains at this level are associated with improved food security, asset growth and economic stability.
Our graduation metric is designed for program decision-making in last-mile farming contexts. Unlike global poverty lines, which use per-capita, purchasing power parity—adjusted consumption for cross-country monitoring, we assess graduation using household income and production measured at nominal exchange rates to understand livelihood sustainability at the household and community level.
We focus on the following indicators:
- Household Income and Production: HHI+P represents income generated by a household from all sources, including unsold agricultural produce and livestock and livestock products consumed. Improved agriculture value and income from seasonal and perennial crops remains the most significant contributor to higher HHI+P in partner communities.
- Program Value: To assess the overall benefit of our program, we look at the cumulative or Total Program Value. This represents the gains in Annual Household Value (Household Income, Net Production and Livestock Assets) achieved by Raising The Village–member households over the evaluation period compared to peer households. We calculate these gains by comparing changes between the two groups across multiple points.
- Return on Investment (ROI): Calculated as the Total Program Value minus the one-time average investment/partner household, divided by the average investment/partner household.
- Impact Efficiency: The total benefit per dollar invested expressed as a return multiple, indicating the value unlocked for every dollar spent. Return on Investment (ROI): Calculated as the Total Program Value minus the one-time average investment/partner household, divided by the average investment/partner household.
We use a longitudinal research design, following the same households for five years from baseline to measure change over time. To assess program impact, outcomes for participating households are compared with similar peer households in non-program communities.
We apply randomized, stratified probability sampling once at baseline using the full village census as a sampling frame. We stratify households by type: men-headed, women-headed and youth-headed). We sample villages with more than 100 households at 30 households (60/20/20 stratification) and villages with fewer than 100 households at 24 households (50/25/25 stratification). If a sampled household withdraws, we replace it with a reserve household with similar characteristics to maintain statistical integrity throughout the longitudinal study.
Peer communities (control group) receive no intervention. Comparing treatment and control outcomes over time isolates the incremental effect of our programming.
We conduct surveys using SurveyCTO, with logical checks and speed violation tracking. Independently trained enumerators collect data under strict protections, overseen by supervisors. GPS validation links location to survey timing. Random backchecks and callbacks are conducted on 10 percent of households. Additional audits include audio recordings (with consent), market price caps, and field testing prior to deployment.
Difference-in-differences compares pre- and post-intervention changes in outcomes across treatment and control villages. The impact of the program is calculated as the second difference minus the first difference, isolating the treatment effect apart from external factors.
We use Alteryx workflows, STATA and Python for regression analysis. Univariate, bivariate and multivariate methods examine relationships between key variables and household incomes. Outlier management removes the bottom 1 percent and top 4 percent of household program values separately for treatment and control cohorts to achieve normal distribution and comparability before analysis.
Published results require a 95-99 percent statistical confidence level (p ≤ 0.05 or p ≤ 0.01).
New indicators are added to expand outcome measurement, aggregation methods are refined to support regional scalability, and digital workflows reduce entry errors and streamline data collection.
Rigorous evidence guides program refinement, enables earlier course correction during delivery rather than after, strengthens cost efficiency, and ensures impacts are real, significant and scalable.